
How to debug python with VS Code easy and fast
Debugging is a essential task as a developer and learning the different available debugging tools are a good way to understand more how to do it properly.
This tutorial is focused around the idea of debugging as a must-do that may be needed in different situations. We start it talking about what is debugging and why you should be doing it. Furthermore, we will see how to perform it in python with print(), breakpoint(), pdb and vscode.
Introduction
“When debugging, novices insert corrective code; experts remove defective code.” ~ Richard E. Pattis
What is debugging?
As the name states, the act of debugging a computer program could be seen as removing or fixing bugs. In that sense, we could model the computer code as a car’s engine and our job while debuggers would be to take out the insects infesting it. This is totally disconnected to the reality, because as a matter of fact, the engine and the bugs are the same things most of the time.
I believe a better model would be to see the computer code as any other human tool: it has one or more intents and mechanisms by which this intents are delivered.
Let’s take that car again. A car has many intents: transporting people, carrying stuff around, moving forward, backward, some of them even flip. For these intents to be well delivered, the car has several tools: gas, mirrors, doors, engine, wheels and much more. Thus, all the tools have to be working together so that the intents can be perfectly fulfilled.
All right. What am I going for here? You’ll get it in a minute.
Suppose now we own a car, we are driving the car and suddenly it stops. He tries to turn it back on. Not a sign. We say “it’s broken”. Besides the fear and anger when something like this happens, we know that it is just one of the car parts that stopped working. The frustrating thing in this kind of situation is that we don’t have any tools for investigating what specifically broke. Then, we call insurance and take the car to the repair shop, because they have the necessary equipment, and they tell us our tank was filled with water! The horror!
Okay, I’m finished with my story. Now, what was the bug and what is debugging?
The bug is actually not the water. The bug is actually the limitation that cars have on fuel. The car industry solves this bug by telling us not to put water in the car tank (and you thought you would be bad at debugging). Therefore, debugging was the actions the repair shop took to find the bug!
Every human-made tool has its limitations and it is impossible to fix them all. On the other hand, under some specific scope of intention that the tool has, we can surely make it work! In programming environments, bugs would be all unexpected behaviors the user finds, even though it did everything right. Hence debugging is the process seeing what is going on “inside” the program while it executes or at the moment it crashed.
How Debugging will solve your problems?
As stated, debugging gives you a new power as a developer: the ability to investigate code inside-out. There are many common problems developers face daily that by harnessing debugging tools could be solved easier.
- Understanding other people code
- if you got to a project with an giant legacy codebase or can’t grasp what a small script does, try running the code in debugging mode to figure out what is going on.
- Finding bugs
- this one confuses some people. Imagine you have a piece of code that as far as you know does its job right. If this is an important function, watching it run in debugging mode can lead you to insights on specific parts that could break everything and no one thought of it yet.
- Optimizing code
- With tools, such as a profiler, you can spot the bottlenecks in your code. On the other hand, debugging lets you investigate in real time why is it a bottleneck and might take you faster to the optimizations you have to do.
- Learning
- If you’re new to some tool, language, protocol, process, codebase or wants to find out what is going on inside something, debugging will make you learn and understand it easier and faster than just reading it. Besides, it’s more enjoyable.
- Reverse Engineering
- Debugging and reverse engineering have a lot in common. If you are interested in it, this could be a starting point!
How Debugging will make you develop better?
What makes you a better developer? This has many answers, but I say it would be anything that gives you the capacity to think before you code. Debugging is all about that.
I believe this, because debugging is about collecting information and data before any action. Therefore, if you do good debugging, probably your code is going to be good as well.
Beyond that, it is a very general tool, that can be used in almost any situation. Personally, I see good debugging together with good testing as the swiss army knife (image) of software engineering.
How Debugging will make you develop faster?
Sometimes the startup time the debugging tools have might fool us to think that filling our code with calls to print() would be faster. When you only insert a single print(), it might even be true, although this is hardly what happens. On most cases, marking your breakpoints and pressing F5 on vscode will be faster.
I confess that this is not really obvious at first and might not be true to all cases. Nevertheless, just like testing, debugging will lead to easier development in the long run and the easier you code, the faster you code.
Imagine that you are developing some app or program for quite sometime now and suddenly a strange bug starts to appear. You read your code fast, spot the problem and add some code to fix it. Does this reminds you of something? All right, if you keep doing this, you’re actually building a card castle and it’s going to fall sooner than you think.
When you keep making this small fixes, the real bugs are not being solved, for usually they are deeper than you can see. In due time you will start making more and more stops and then you will not be developing anything new anymore. You’ll be stuck with bugs you don’t even understand how they are possible. Your code is now pure magic.
I know this sounds ridiculous and it should be. The point here is that if you never stop to review, test or debug your code, it is going to start making your development slower. As a rule of thumb, I’d say that if your code is over 400 lines total (considering all the files you wrote), you should start to think about it.
Setting Up Visual Studio Code
Let’s start this tutorial with a basic setup for VS Code. This is a very good yet simple configuration that I use in all my VS Code Python projects, as it configures the pep8 formatter, intellisense, the python interpreter version, github repo and some useful VS Code extensions. You don’t have to follow all the steps, but some are required, so if further on the reading you face any difficulties, come back here for troubleshooting. The steps marked with * are not essential.
I will show you now a simple and automatic way of setting up your environment with vscode and Docker:
Setup with Remote Development extension pack
This a very useful VS Code extension created by Microsoft that let us develop inside docker containers. With this extension, we are able to download a pre-configured python project (even if we don’t have Python installed in the computer). The only requirements are VS Code and Docker, but if you don’t know anything about Docker, don’t worry, for I will thoroughly instruct the Docker related steps. Besides, if you have a hard time with this step or want to know more about it, I do have a specific
Remote Development extension pack tutorial</Link> you can look.
1. Install Docker on your computer
Install Docker on Linux
- open the linux terminal (try Ctrl + Alt + T or look for it in the search bar)
-
type the following commands:
❯ sudo apt-get update ❯ sudo apt-get install docker-ce docker-ce-cli containerd.io - For detailed instructions, refer to the official docker engine installation guide.
Install Docker on MacOS
- download Docker Desktop (Stable) for MacOS clicking here.
- Once it is downloaded, look for
Docker.dmgfile on Finder and click it. - For detailed instructions, refer to the official documentation.
Install Docker on Windows
- download Docker Desktop (Stable) for Windows clicking here.
- Once it is downloaded, run the installer
Docker Desktop Installer.exefile. You may need to restart your PC. - For detailed instructions, refer to the official documentation.
2. Install Remote Development extension pack
With Docker and Visual Studio Code installed, we just need the Remote Development VS Code extension. Click on the link below to go to the download page.
link to remote development extension
3. Start a new python project
Now that we have the extension, your VS Code interface might be a little bit different and you might see some new icons on the left sidebar. Now we will start a new vscode docker python project and this extension makes all the process very simple.
- Click on the new symbol in the lower left corner. A dropdown list of options will appear.
- Select Remote-Containers: Try a Sample… from the command list. A list of the available languages will be shown.
- Choose Python. The screen will blink and start downloading the images to start your project.
- This step may take from 5 to 15 minutes. Wait for it to finish.
- After the download is over, on VS Code, an workspace will be created with the project files.
- If you have any doubts, check the video below to see each step exactly.
video: title: "create vscode python project": ./videos/python.mov
4. Configuring your Python Development Environment*
After the docker container has been created, you will see some files on the file explorer. We are now going to understand how these files configure our environment.
Changing the Python version*
On the file explorer, at the top, you will see the .devcontainer folder and inside it, the devcontainer.json file. This file is related to the Remote Development VS Code extension and is responsible for configuring the docker container.
- Click on the
.devcontainer/devcontainer.jsonfile to open it.- This is a
.jsonfile. If you aren’t familiar with it, it is just like a pythondict.
- This is a
- On the beginning of the file, you will find the
"VARIANT"argument that settles the Python version.{ "args": { "VARIANT": "3.7" } } - Change the python version to
"VARIANT": "3.8". - Save the file with Ctrl + S or ⌘ + S.
- Click on the button on the lower left corner that says Dev Container: Python 3 Sample. A dropdown will pop up.
- Select Remote-Containers: Rebuild Container from the command list. VS Code will blink and it will start rebuilding the container. This will take about 5 minutes.
- After the process is completed, open the vscode terminal with Ctrl + \` or ⌃ + \`. Assert it says
1: bashon the select box at the upper right corner of the terminal window. This is the bash terminal of the linux docker container vscode has created. - type the following to see the updated python version.
vscode@978bae730087:/workspaces/vscode-remote-try-python$ python --version Python 3.8.3 - If you see
Python 3.8.xon the output, congratulations, it has worked!- obs.: some names might differ from my vscode container to yours! Not everything has to be the same.
Changing vscode settings*
VS Code has a collection of specific and extension related settings that we can enable or modify for a better developer experience. On the file explorer, at the top, you will see the .devcontainer folder and inside it, the devcontainer.json file.
- Click on the
.devcontainer/devcontainer.jsonfile. - At the end of the file, we’ll find the
extensionsarray. Here it is possible to include vscode extensions to be installed in the container when it is created.{ "extensions": ["ms-python.python"] }- we see that the Microsoft
pythonextension is already included. With it, many useful functionalities are added to.pyand python related files, such as intellisense. Besides, now we are allowed to specifypython.settings in vscode.
- we see that the Microsoft
- On the middle of
devcontainer.json, we can see vscodesettingsthat were installed when the container was created{ "settings": { "terminal.integrated.shell.linux": "/bin/bash", "python.pythonPath": "/usr/local/bin/python", "python.linting.enabled": true, "python.linting.pylintEnabled": true, "python.formatting.autopep8Path": "/usr/local/py-utils/bin/autopep8", "python.formatting.blackPath": "/usr/local/py-utils/bin/black", "python.formatting.yapfPath": "/usr/local/py-utils/bin/yapf", "python.linting.banditPath": "/usr/local/py-utils/bin/bandit", "python.linting.flake8Path": "/usr/local/py-utils/bin/flake8", "python.linting.mypyPath": "/usr/local/py-utils/bin/mypy", "python.linting.pycodestylePath": "/usr/local/py-utils/bin/pycodestyle", "python.linting.pydocstylePath": "/usr/local/py-utils/bin/pydocstyle", "python.linting.pylintPath": "/usr/local/py-utils/bin/pylint" } }autopep8,blackandyapfare formatting tools.autopep8is the vscode default value.bandit,flake8,mypy,pycodestyle,pydocstyleandpylintare python linters.pylintis enabled as you can see through"python.linting.pylintEnabled": true.
- Let us now change these settings. At the
.vscodefolder, create a newsettings.jsonfile.- we could change the settings at
devcontainer.json, but for them to take effect, a container rebuild would be necessary at every change. We will avoid it here.
- we could change the settings at
- Click on the
.vscode/settings.jsonfile to open it.- at
settings.json, we can specify vscode local settings for the workspace.
- at
- Add the lines below to modify a few settings.
{ "python.formatting.provider": "black", "editor.formatOnSave": true, "files.autoSave": "onFocusChange", "python.linting.banditEnabled": true }-
"python.formatting.provider": "black": we change the default formatter toblack. "editor.formatOnSave": true: every time a file is saved, it is automatically formatted."files.autoSave": "onFocusChange": the files are automatically saved when the editor focus changes (changing files, move tabs, etc.)-
"python.linting.banditEnabled": true: thebanditlinter is enabled.Attention: Notice that many linters can be
enabled, but only one formatter can be theprovider.
-
- Save the
settings.jsonfile. For now on, these settings are enabled. If you want to change any other settings, just edit this file.
Configuring git and github repo*
A crucial part of virtually all programming projects is version control. When you start your Python Container Project, a git repository will be cloned (the .git folder is hidden by default) from github. However, its remote repo is owned by Microsoft, what means we cannot change it. This step will help you create a new github repo, tell your project to point to it and push your files there.
- Create the github repo.
- Head over to github.
- Sign Up if you don’t have a github account, or Log In if you do.
- On the upper right corner, you will se a ➕ (plus) sign. Click on it and then on
new repository(or just click here).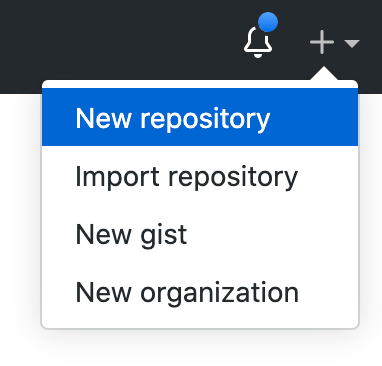
- Fill in the new repository form as you like.
- if you add a
LICENSEorREADME.mdfile, you’ll need to do some git conflict resolution later on as the current project already has these files.
- if you add a
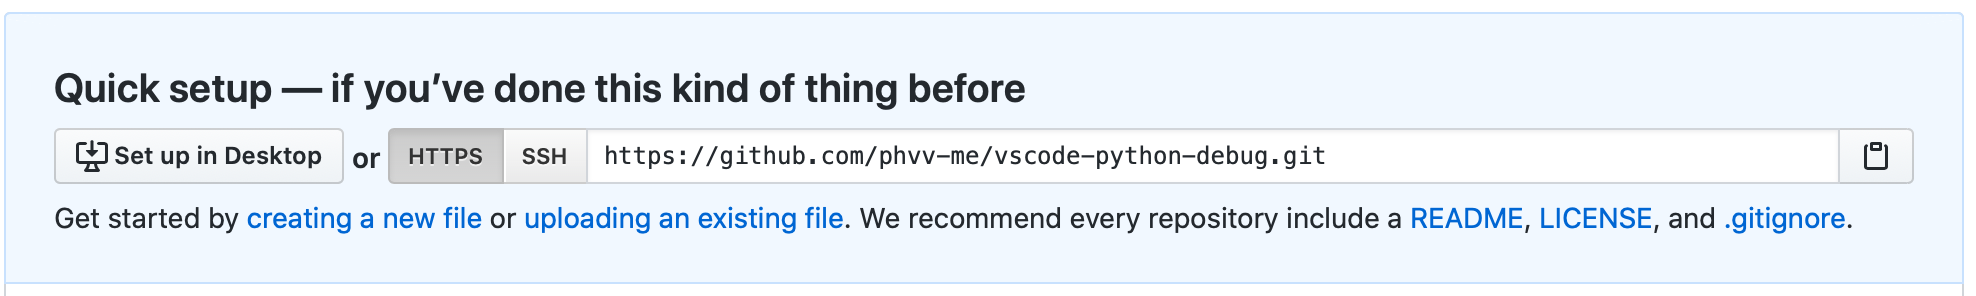
- Click on the
Create repositorybutton. - At the new screen, on the middle, you’ll see a link to the repo you just created. Copy it.
- With our new repo link copied, go back to vscode and open the terminal with Ctrl + \` or ⌃ + \`.
- At the terminal, assert you’re at the project root folder. You can do this by typing
ls. You should see the project files.vscode@978bae730087:/workspaces/vscode-remote-try-python$ ls LICENSE README.md app.py requirements.txt static - Now, git repos have what is called a remote repo. We can see the current remote repo with
git remote -v.vscode@978bae730087:/workspaces/vscode-remote-try-python$ git remote -v origin https://github.com/Microsoft/vscode-remote-try-python (fetch) origin https://github.com/Microsoft/vscode-remote-try-python (push) - It is pointing to a Microsoft owned repo. To change it simply type
git remote set-url origin {your-url-here}, where{your-url-here}should be exchanged with the link you had copied. After it, check the change withgit remote -vagain.vscode@978bae730087:/workspaces/vscode-remote-try-python$ git remote set-url origin https://github.com/phvv-me/vscode-python-debug.git vscode@978bae730087:/workspaces/vscode-remote-try-python$ git remote -v origin https://github.com/phvv-me/vscode-python-debug.git (fetch) origin https://github.com/phvv-me/vscode-python-debug.git (push) - All right! Your remote repo has been changed. Now it’s time we push our project files there. Type
git pushat the terminal and it will send your files to github. Go back to your github repo and refresh the page to see the changes. ```bash vscode@978bae730087:/workspaces/vscode-remote-try-python$ git push Enumerating objects: 172, done. Counting objects: 100% (172/172), done. Delta compression using up to 2 threads Compressing objects: 100% (84/84), done. Writing objects: 100% (172/172), 38.42 KiB | 2.40 MiB/s, done. Total 172 (delta 82), reused 171 (delta 82) remote: Resolving deltas: 100% (82/82), done. To https://github.com/phvv-me/vscode-python-debug.git- [new branch] master -> master
```
Note: notice there are previous commits that had been done by the Microsoft staff that created the original repo.
- [new branch] master -> master
```
- At the terminal, assert you’re at the project root folder. You can do this by typing
- We are finished with the git command line interface. However, there is still some git stuff to be done. You may notice that the files we had previously edited are unchanged at your new repo. That’s because we have not committed them yet. We will do this now with vscode git source control.
- On the left side bar, click on the source control icon to open the source control: git tool. It will have a pink circle with a number inside indicating the number of files that have been modified since the last commit.

- On the input box type a message to represent the files being commited.
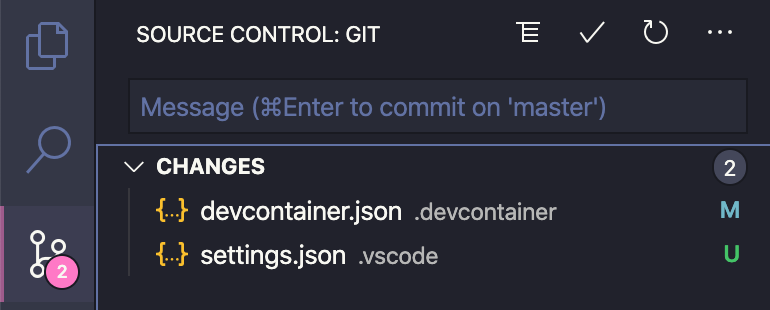
- Click on the ✔️ check mark to commit them. An alert box might pop up, click yes.
- Click on the … three dots icon and then on push.
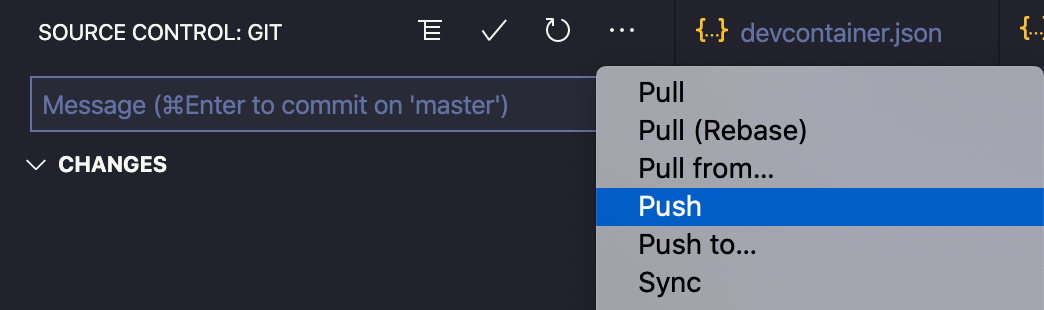
- Your files have been pushed to github. Go back to your github repo and refresh the page to see the changes.
- On the left side bar, click on the source control icon to open the source control: git tool. It will have a pink circle with a number inside indicating the number of files that have been modified since the last commit.
Setup without Remote Development extension pack
25 - 47 minutes
Debugging in Python
This part is the simple and short introduction to the python debugging tools you needed yet didn’t know. We will talk about the print() and breakpoint() builtin functions and also a little about the pdb module. It’s actually a very important part of this post, because this might take your python skills to the next level.
Debug Python with print()
In every language there is a way to show data in the console, and python is no different. The print() function is very flexible and convenient and can help to debug sometimes. Below you can see the print() function with all of its arguments, but I will focus on the basic use here. For more information, you can read the official print docs or this awesome real python post.
print(*objects: Iterator[object], sep: str = ' ', end: str = '\n', file: writable = sys.stdout, flush: bool = False)
How to use print() for debugging?
The usage of print() as a debugging tool is very intuitive and most people might do this even though they’ve never heard of debugging before. Suppose you have a script calling a function,
my_name = "Tom Thompsom"
your_name = "Lauretius Maximus"

the_best_name = define_best_name(my_name, your_name)
In this situation, if I want to see the value returned by the define_best_name() function, the most obvious way would be to print it:
print(the_best_name) # "Lauretius Maximus"
However, what to do if I find this result wrong? As you might know, functions have closed scope in python, meaning that we cannot see the variables inside of it. Despite that, we could see what is going on inside of it by inserting one print() call there.
def define_best_name(name1, name2):
    length1 = len(name1)
    length2 = len(name2)

    print(length1, length2)

    if length1 > length2:
        return name1
    return name2
Then, when I call my script again, I would see the print statements in the console. Now I can understand a little bit better the result.
$ python debugging101/print.py
12 17
Lauretius Maximus
When using print() for debugging is acceptable?
That’s a tricky question. Most people would say never, but I believe that, for very small projects and some programming experiments, there is no harm in using it. On the other hand, it could damage the code development if abused.
Personally, I think that print() and the console in general can help you to build your code and experiment different approaches. That’s why the jupyter notebook and IPython projects got so big. When you don’t know exactly how to do something or what some function or method returns and wants to investigate, printing it could help a whole lot.
Why print() for debugging should be avoided?
-
The
print()function is not intended for debugging purposes: it creates code smells.- the console should have information useful to the user/developer. In our previous example, if someone else used that script and saw
12 17in the console without a hint of context, they would think that would be a bug! - Thus, we as developers would have to remember to remove the
print()function after debugging… but we know how often that happens, hun? - On the other hand, if someone else read our function code, they would say it is a smelly code (don’t get it personally, it’s an expression) and that we should change it for
def updated_define_best_name(name1: str, name2: str):
  if len(name1) > len(name2):
    return name1
  return name2
- the console should have information useful to the user/developer. In our previous example, if someone else used that script and saw
-
It adds significant overhead
- the
print()function is fast, but showing things in the console can be slow. - Therefore, if you have a recursive function or a very long loop, inserting a
print()statement would not be a good idea.
- the
-
It does not help understanding other people code
- If you are modifying third party libraries or even the standard library to insert
print(), you’ve gone too far, my friend. There are better tools to assessing these libraries, such as the official documentation and real debugging tools. - Moreover, even if that is your comrade’s code, asking him about it could help you more.
- Most commonly, I’d say you’d lose time doing this than discovering anything.
- If you are modifying third party libraries or even the standard library to insert
-
Printing is only one part of debugging
- While debugging, you’ll want to get the variables values, but you might want to modify them or even add some code in the middle as well. Print only show the values.
Debug Python with breakpoint() and pdb module
Considering how essential debugging is to programming in general, python has a standard library module called pdb — The Python Debugger — that adds a interactive source code debugger for Python programs. Besides, since Python 3.7, we have the breakpoint() builtin function, that is equivalent to using pdb in most cases.
How to use python breakpoint()?
The breakpoint() function is a useful shortcut for debugging python code. As its name states, it inserts a breakpoint in the code execution: a breakpoint is a line the code will pause its execution without terminating. Thereafter, we can analyze the program current state.
When a breakpoint is reached, there are some things we can do:
- print values
- step over (go to next line, but stay in the same level)
- step into (go to the next line, but enter the function/method if possible)
- see other lines
- change variable values
- set new breakpoints
- quit the debugging console
- much more
We will see all of these in action with the following script, but don’t worry if you cannot grasp exactly what it is doing just by reading it: we will understand the my_range() function by debugging it!
def my_range(start: int, end: int, step: float = 1):
    step_is_integer = bool(int(step))

    if step_is_integer:
        _range = range(start, end, step)
        return list(_range)

    _range = [start, ]
    while _range[-1] <= end:
        next_value = _range[-1] + step
        _range.append(next_value)

    return _range[:-1]

range1 = my_range(0, 1, .11)
range2 = my_range(0, 1, 2)
range3 = my_range(10, 12, .5)
Adding the breakpoint()
We got this strange piece of code and have to understand how it works before we can update or optimize it. Okay, the first thing we want to know is how range1, range2 and range3 look like. So, to start our code analysis, we insert the breakpoint() just between them. Our ne code looks like this:
def my_range(start: int, end: int, step: float = 1):
    step_is_integer = bool(int(step))

    if step_is_integer:
        _range = range(start, end, step)
        return list(_range)

    _range = [start, ]
    while _range[-1] <= end:
        next_value = _range[-1] + step
        _range.append(next_value)

    return _range[:-1]

range1 = my_range(0, 1, .11)
breakpoint()
range2 = my_range(0, 10)
range3 = my_range(10, 15, 1.5)
1. printing values
We may now execute the code. Open the vscode terminal window with Ctrl + \` or ⌃ + \` and run the python file you created.
vscode@978bae730087:/workspaces/vscode-remote-try-python$ python debugging101/breakpoint.py
> /workspaces/vscode-remote-try-python/debugging101/breakpoint.py(19)<module>()
-> range2 = my_range(0, 10)
(Pdb)
You should see something like the above in your console. Let’s understand it:
- debugger position
> /workspaces/vscode-remote-try-python/debugging101/breakpoint.py(19)<module>()- the python module being executed:
/workspaces/vscode-remote-try-python/debugging101/breakpoint.py - the line that the debug console shows below:
(19) - the location we are paused - currently at module level:
<module>()
- the python module being executed:
-> range2 = my_range(0, 10)- the next line to be executed - it has not been executed yet.
(Pdb)- the debug console input prompt - it waits for a command.
We have the program paused at the breakpoint() we inserted. Notice that range1 was successfully assigned, because no errors were shown. Then, we can print its value.
For this, we have the p command: type p range1 at the (Pdb) prompt to print the variable. We will see that range1 points to a list.
(Pdb) p range1
[0, 0.11, 0.22, 0.33, 0.44, 0.55, 0.66, 0.77, 0.88, 0.99]
(Pdb)
On the other hand, if we try to print range2 or range3, we will be thrown a NameError, meaning these variables have not been defined yet.
(Pdb) p range2
*** NameError: name 'range2' is not defined
(Pdb) p range3
*** NameError: name 'range3' is not defined
(Pdb)
2. step over
The most obvious way to see range2, then, is to let the program continue and execute the next line.
For this, we have the n(ext) command: type n at the (Pdb) prompt to execute the line that was shown at -> and pause again.
(Pdb) n
> /workspaces/vscode-remote-try-python/debugging101/breakpoint.py(20)<module>()
-> range3 = my_range(10, 15, 1.5)
(Pdb)
You should see something like the above in your console. Notice the line has changed to (20) and the next line assigns a value to range3. Now we are able to print range2 with p range2.
(Pdb) p range2
[0, 1, 2, 3, 4, 5, 6, 7, 8, 9]
(Pdb)
I believe that we can try to guess what my_range() does, isn’t it? It mimics the python builtin range(), but it returns a list and accepts a float step while range() only accepts integers. On the other hand, knowing what it does doesn’t mean we know how it works! Let’s further investigate it to find out.
3. step into
After the last command, the debugger console showed us that the next line has a call to my_range() again. We can investigate a function by stepping into it.
For this, we have the s(tep) command: type s at the (Pdb) prompt to execute the the current line, but stop at the first possible occasion (what means it will stop in a line inside the function).
(Pdb) s
--Call--
> /workspaces/vscode-remote-try-python/debugging101/breakpoint.py(2)my_range()
-> def my_range(start: int, end: int, step: float = 1):
(Pdb)
You should see something like the above in your console. Let’s understand it:
--Call--- the execution stopped inside another function.
-
> /workspaces/vscode-remote-try-python/debugging101/breakpoint.py(2)my_range()- the python module being executed is still the same:
/workspaces/vscode-remote-try-python/debugging101/breakpoint.py- if the function had been imported, it would be different. - the line that the debug console shows at
->is number(2) - we are paused inside
my_range()function
- the python module being executed is still the same:
-> def my_range(start: int, end: int, step: float = 1):- we see that the next line starts the function definition.
(Pdb)- the debug console input prompt waiting.
4. see other lines
Now that we are inside the function, you might want to see again how it looks like - this is mostly useful when the function was defined in another module. There are two commands for print: l(ist) and ll (longlist) - the first lists a fixed number of lines while the second list all the source code inside the function or module.
Then, type ll at the (Pdb) prompt to see the whole function.
(Pdb) ll
  2  -> def my_range(start: int, end: int, step: float = 1):
  3         step_is_integer = bool(int(step))
  4
  5         if step_is_integer:
  6             _range = range(start, end, step)
  7             return list(_range)
  8
  9         _range = [start, ]
 10         while _range[-1] <= end:
 11             next_value = _range[-1] + step
 12             _range.append(next_value)
 13
 14         return _range[:-1]
You should see something like the above in your console. The -> symbol sings the next line to be executed.
5. changing variable values
Inside the function, our job is to try to understand how it works and find possible bugs. In order to do this, we’ll need …
- type
ntwice for us to get the first defined variable.(Pdb) n > /workspaces/vscode-remote-try-python/debugging101/breakpoint.py(3)my_range() -> step_is_integer = bool(int(step)) (Pdb) n > /workspaces/vscode-remote-try-python/debugging101/breakpoint.py(5)my_range() -> if step_is_integer: (Pdb) -
type
p step, step_is_integerto see a tuple with the value ofstepandstep_is_integer.(Pdb) p step, step_is_integer (1.5, True) (Pdb)- the name of the variable
step_is_integertogether with the-> if step_is_integer:statement and the value ofstepindicates that its purpose is to verify if thestepvariable is of typeint. However, you might have noticed by now that its definition is wrong:step_is_integer = bool(int(step))only indicates if thestepvariable is of typeintwhen-1 < step < 1. - be prepared: it won’t be as obvious in real life: I could have called it
flagand you’d need to investigate further.
- the name of the variable
-
we found a bug! type
!step_is_integer = Falseto change it to the correct value.(Pdb) !step_is_integer = False (Pdb) p step_is_integer False (Pdb)- the
!lets us execute python statements: this is a powerful way to inspect the program being debugged; it is even possible to change a variable or call a function. - if you want to see the error that appears, you can reset
step_is_integertoTrueand typecto continue the execution of the program until it is over. After it ends, just start over until this step.
- the
-
type
nto get to the next line and skip the condition:(Pdb) n > /workspaces/vscode-remote-try-python/debugging101/breakpoint.py(9)my_range() -> _range = [start, ] (Pdb) ll 2 def my_range(start: int, end: int, step: float = 1): 3 step_is_integer = bool(int(step)) 4 5 if step_is_integer: 6 _range = range(start, end, step) 7 return list(_range) 8 9 -> _range = [start, ] 10 while _range[-1] <= end: 11 next_value = _range[-1] + step 12 _range.append(next_value) 13 14 return _range[:-1] (Pdb)- you can also use
llto verify that we skipped the condition.
- you can also use
6. setting new breakpoints
As we could see with ll, a while loop will start. This is a good opportunity to see how we can set new breakpoints during debugging.
For this, we have the b(reak) command. This is a versatile operation, we will use b 11 to set a breakpoint at line 12 of the current module, but it is also possible to watch other modules, function calls or conditions with this command as well. Besides, we can specify a list of commands for breakpoint with commands [breakpoint number] to customize the breakpoint. Follow the steps below:
-
start with
nto create the_rangevariable. We can see it withp _range.(Pdb) n > /workspaces/vscode-remote-try-python/debugging101/breakpoint.py(10)my_range() -> while _range[-1] <= end: (Pdb) p _range [10] (Pdb) -
From now on, it will enter the loop. We want to see the evolution of
_range, but don’t want to typendozens of times. Therefore, we will set a breakpoint inside the loop at line 12 withb 12.(Pdb) b 12 Breakpoint 1 at /workspaces/vscode-remote-try-python/debugging101/breakpoint.py:12 (Pdb)Breakpoint 1 at /workspaces/vscode-remote-try-python/debugging101/breakpoint.py:12means we created the breakpoint number 1 located at line12of modulebreakpoint.
-
We want this breakpoint to print
_rangewhen it is hit. Usecommands 1to start the breakpoint command console denoted by(com). Inside of it, setp _rangeand close it withend.(Pdb) commands 1 (com) p _range (com) end (Pdb) -
Now let’s see our breakpoint with
ll. All breakpoints are marked withB.(Pdb) ll 2 def my_range(start: int, end: int, step: float = 1): 3 step_is_integer = bool(int(step)) 4 5 if step_is_integer: 6 _range = range(start, end, step) 7 return list(_range) 8 9 -> _range = [start, ] 10 while _range[-1] <= end: 11 next_value = _range[-1] + step 12 B _range.append(next_value) 13 14 return _range[:-1] (Pdb) -
We still have a problem though. If we use
cto continue, the program may end abruptly when it leaves thewhileloop. Thus, let’s set a breakpoint on thereturnstatement at line14. We can also see the new breakpoint withll(Pdb) b 14 Breakpoint 2 at /workspaces/vscode-remote-try-python/debugging101/breakpoint.py:14 (Pdb) ll 2 def my_range(start: int, end: int, step: float = 1): 3 step_is_integer = bool(int(step)) 4 5 if step_is_integer: 6 _range = range(start, end, step) 7 return list(_range) 8 9 -> _range = [start, ] 10 while _range[-1] <= end: 11 next_value = _range[-1] + step 12 B _range.append(next_value) 13 14 B return _range[:-1] (Pdb) -
We can see all the breakpoints and some info about them using
bwithout arguments.(Pdb) b Num Type Disp Enb Where 1 breakpoint keep yes at /workspaces/vscode-remote-try-python/debugging101/breakpoint.py:12 2 breakpoint keep yes at /workspaces/vscode-remote-try-python/debugging101/breakpoint.py:14 (Pdb) -
Now, we can see the evolution of
_rangeeasier with 5 xc.(Pdb) c [10] > /workspaces/vscode-remote-try-python/debugging101/breakpoint.py(12)my_range() -> _range.append(next_value) (Pdb) c [10, 11.5] > /workspaces/vscode-remote-try-python/debugging101/breakpoint.py(12)my_range() -> _range.append(next_value) (Pdb) c [10, 11.5, 13.0] > /workspaces/vscode-remote-try-python/debugging101/breakpoint.py(12)my_range() -> _range.append(next_value) (Pdb) c [10, 11.5, 13.0, 14.5] > /workspaces/vscode-remote-try-python/debugging101/breakpoint.py(12)my_range() -> _range.append(next_value) (Pdb) c > /workspaces/vscode-remote-try-python/debugging101/breakpoint.py(14)my_range() -> return _range[:-1] (Pdb)_rangeis printed at every breakpoint with exception of the last one._rangeappends a new element that isstepbigger than the last one at every breakpoint.
-
At the last breakpoint, we see
return _range[:-1]instead of simplyreturn _range. Let’s try to understand this withp _range(Pdb) p _range [10, 11.5, 13.0, 14.5, 16.0] (Pdb)- The problem here is that the last number is the one used to get out of the loop
while _range[-1] <= end, but it is being discarded in the end, for it is bigger than theendvariable upper bound. - This can be optimized. It can be seen as a little thing, but might be the reason of a memory overflow for someone.
- The problem here is that the last number is the one used to get out of the loop
-
Type
nto end the function and see what it returns(Pdb) n --Return-- > /workspaces/vscode-remote-try-python/debugging101/breakpoint.py(14)my_range()->[10, 11.5, 13.0, 14.5] -> return _range[:-1] (Pdb)--Return--shows us this is the return of the function->[10, 11.5, 13.0, 14.5]shows what is being returned by themy_range()function.
7. quitting the debugging console
With our debugging process over, we can use the q(uit) command to exit the (Pdb) console.
If you exit before the code is actually over, the console shows a traceback with the bdb.BdbQuit exception. This is not a problem, it is just how the Python debugger works. Below, we can see this situation.
```bash
(Pdb) q
Traceback (most recent call last):
  File "debugging101/breakpoint.py", line 18, in <module>
    range2 = my_range(0, 10)
  File "debugging101/breakpoint.py", line 18, in <module>
    range2 = my_range(0, 10)
  File "/usr/local/lib/python3.8/bdb.py", line 88, in trace_dispatch
    return self.dispatch_line(frame)
  File "/usr/local/lib/python3.8/bdb.py", line 113, in dispatch_line
    if self.quitting: raise BdbQuit
bdb.BdbQuit
vscode@978bae730087:/workspaces/vscode-remote-try-python$
```
fixing the bugs after debugging
We found a few bugs in our debugging section (try to find the others as exercise) and there are many ways to fix them. I would actually recommend to refactor my_range() completely as a python class implementing the __iter__() method.
Let’s take a simpler approach though. We have two things to fix:
-
type checking if
stepisint- There is one right way to do number type checking in Python and it’s using the
numbersmodule. Therefore, we will include:
from numbers import Integral # some code... if isinstance(step, Integral): # more code... - There is one right way to do number type checking in Python and it’s using the
-
optimize the
whileloop so we don’t have to discard a value.- This one is quite straightforward - we just subtract
stepfromendso that the last value end inside the interval [end - step, end]
# some code... while _range[-1] <= end - step: # more code... return _range - This one is quite straightforward - we just subtract
-
To further simplify the comprehension, we should add a docstring to inform other developers (and our future selves) what this function does.
- Instead of a docstring, changing the name of the function to something more comprehensible would also be a good practice.
 def my_range_fixed(start: int, end: int, step: float = 1):
   """creates a new range implementation with non-integer step"""
   # code...
- Instead of a docstring, changing the name of the function to something more comprehensible would also be a good practice.
We may implement all these changes in a new my_range_fixed() function. It should look like the following:
from numbers import Integral


def my_range_fixed(start: int, end: int, step: float = 1):
    """creates a new range implementation with non-integer step"""
    if isinstance(step, Integral):
        _range = range(start, end, step)
        return list(_range)

    _range = [start,]
    while _range[-1] <= end - step:
        next_value = _range[-1] + step
        _range.append(next_value)

    return _range
Our debugging session is now completed!
How to use the python pdb module?
The breakpoint() builtin is a shortcut to the pdb.set_trace() function called without arguments. Thus, everything in the How to use python breakpoint section is also valid for the pdb module.
However, the pdb module offers other…
Debugging Python with Visual Studio Code
The vscode IDE offers a very good and simple debugger. The language debugging support comes from the language extension that we use. Since we already have the Microsoft python extension, the debugger is already available.
Getting Started debugging in vscode
We are going to show a fast and easy configuration to start debugging your python files in vscode. This configuration will probably work for most cases, but if it doesn’t help you, we show specific cases further in this tutorial post.
Visual Studio Code relies on the launch.json file in the .vscode folder to configure the debuggers. Then, we are now going to create and edit this file so that we can easily debug our code.
- Create the
.vscode/launch.jsonfile. If you’re following this tutorial from the start, it should already be there, but we won’t use its original configuration, so you may delete it as well. - The
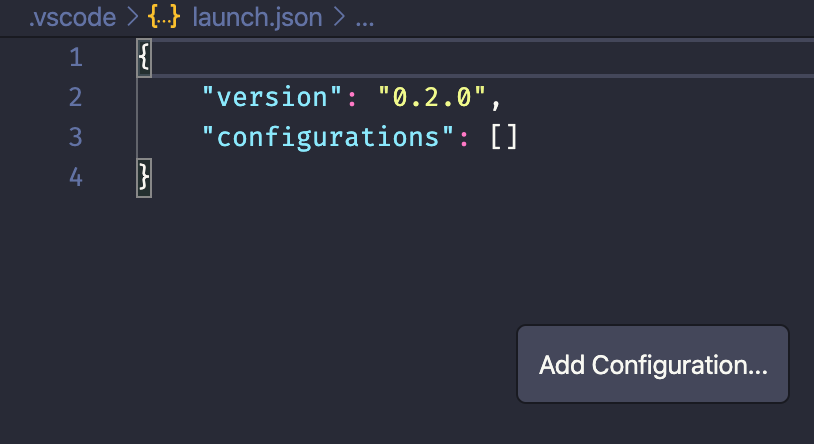
launch.jsonfile has a lot of IntelliSense and easy functionalities builtin. If you see, the Add Configuration... button on the lower right corner, click on it. - A dropdown of different preset options will appear. Click on the
Pythonoption. - A selection of different preset python configurations will be shown. Click on the
Python Fileoption.- assert the configuration is created inside the
[]brackets, for sometimes, when you have the"editor.formatOnSave": trueand"files.autoSave": "onFocusChange"settings enabled atsettings.json, vscode might put the configuration outside.
- assert the configuration is created inside the
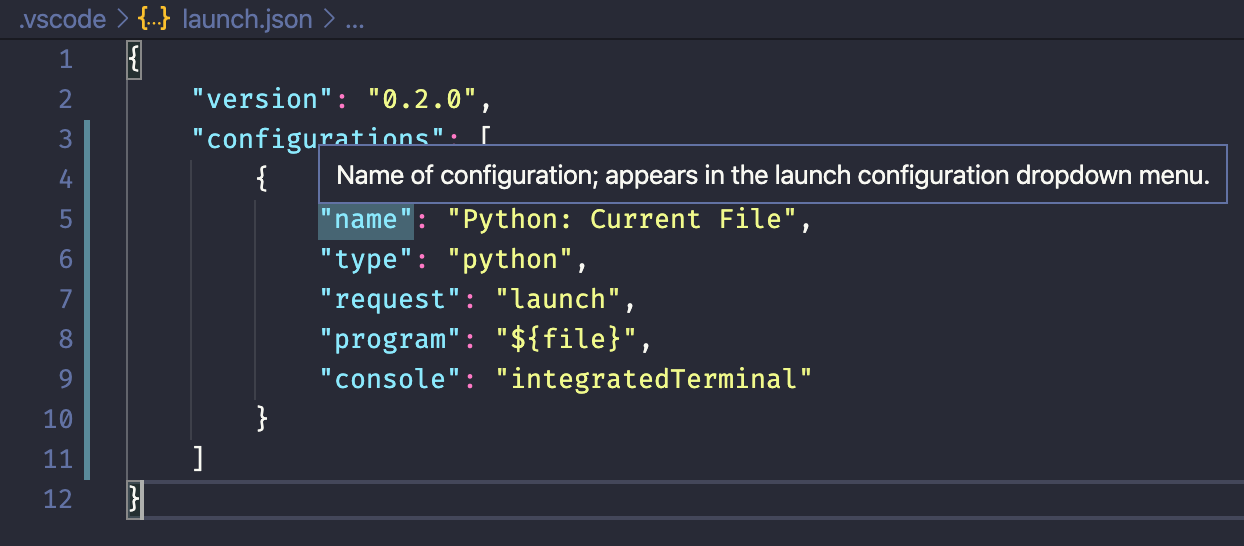
- At this point, your
launch.jsonfile should look like{ "configurations": [ { "name": "Python: Current File", "type": "python", "request": "launch", "program": "${file}", "console": "integratedTerminal" } ] } -
Go to the file you want to debug. I have this
to-debug-in-vscode.pyfile to be investigated.def define_best_name(name1, name2): if len(name1) > len(name2): return name1 return name2 my_name = "Tom Thompsom" your_name = "Lauretius Maximus" the_best_name = define_best_name(my_name, your_name) - Hover the mouse over the line numbers on the vscode editor to show a small red circle 🔴. Clicking on it will set a breakpoint: a line the program will pause. On my code, I will set a breakpoint on the last line.
- Click F5 to launch your file with the debugger attached.
- While the debugger is running, you’ll see many differences on the vscode interface:
- on the middle top there is the debugger control toolbar.
- on the bottom, the status bar will change color.
- on the left, the sidebar will show information about the active debugging section.
- When the breakpoint is hit, the line will be highlighted.
- While the debugger is running, you’ll see many differences on the vscode interface:
- Click F11 or the Step Into symbol on the top toolbar to move the program inside the
define_best_namefunction definition.- When inside a function, the scope changes. Therefore, notice that the variables under the
Localssection change to the variables at function level.
- When inside a function, the scope changes. Therefore, notice that the variables under the
- On the left sidebar, right click under
WATCHand addlen(name2)as an expression.- The
WATCHsection allows you to type any valid python expression: try putting expressions that return a value, otherwise you’ll only seeNone.
- The
- On the left sidebar, click twice at the
name2variable underLocalsand change its value to"Not best".- The
name2variable has been overwritten while the originalyour_namevariable stays unmodified. - Notice that the
len(name2)expression changed from17to8.
- The
- Click F12 or the Step Over symbol on the top toolbar to go to the next line.
- It is going to hit
return name1, because the value fromname2has changed and the result is affected.
- It is going to hit
- Click Shift + F11 or ⇧ + F11 or the Step Out symbol on the top toolbar to go back to the stack frame
<module>level.- We are now back at the same point, but the function has returned, so it is possible to see what it returned under
Localsat(return) define_best_name. - Notice this value has not yet been assigned to the
the_best_namevariable. - Besides, the
len(name2)expression now returns an error, since there is noname2variable at this scope.
- We are now back at the same point, but the function has returned, so it is possible to see what it returned under
- Click F5 or the Continue symbol on the top toolbar to unpause the program and let it finish its execution.
With simple and straightforward commands, we could configure a python debugger, watch expressions, change variables values and set breakpoints in our code debugging session. These are enough for most debugging cases you’ll probably need.
However, there is a lot more to launch.json than we’ve seen so far and also specific cases that still need to be addressed, such as classes, asynchronous programming, server side and third-party libraries debugging. All of these and a few more will be shown on the next sections.
About launch.json
The launch.json file is a vscode related file that has to be located at the .vscode folder. This file enables configurations to the Run tool. The Run tool can be used to run your code or debug it. launch.json always looks like this:
{
  "version": "0.2.0",
  "configurations": [
    {
      "name": "the name of my configuration"
      // other configs...
    }
  ]
}
versionrefers to the file format and is an optional argument that actually accepts any value. It is used only by the developer.configurationssets the possible ways to Run or Debug the code in your workspace. When you add a new configuration here, it goes to a selector at the top of the Run sidebar.
When you open launch.json at the editor, vscode enables special IntelliSense and lets you add configurations in a very simple manner. The Add Configuration button opens a dropdown with all the available run/debug options. Some options are included in vscode while others come from the extensions you have enabled.
We have the Microsoft Python extension enabled, so let’s add a Python related configuration:
- Click on Add Configuration > Python > Python File to add the most basic python configuration. Your
launch.jsonshould look like this now{ "version": "0.2.0", "configurations": [ { "name": "Python: Current File", "type": "python", "request": "launch", "program": "${file}", "console": "integratedTerminal" } ] }name(required): reader-friendly name show at Run configuration selector.typw(required): the type of debugger to use for this launch configuration. Since we have the Python extension, we can use thepythondebugger.request(required): the debugging mode -launchorattach- more on this later.program: the path to the executable or the file to run when launching the debuggerconsole: where the debug target will be launched -internalConsole,integratedTerminal, orexternalTerminal.
Above I tried to explain what all of these configuration attributes do, but there is actually IntelliSense working for that too! Go to your launch.json and hover your mouse over the attributes to see some explanations.
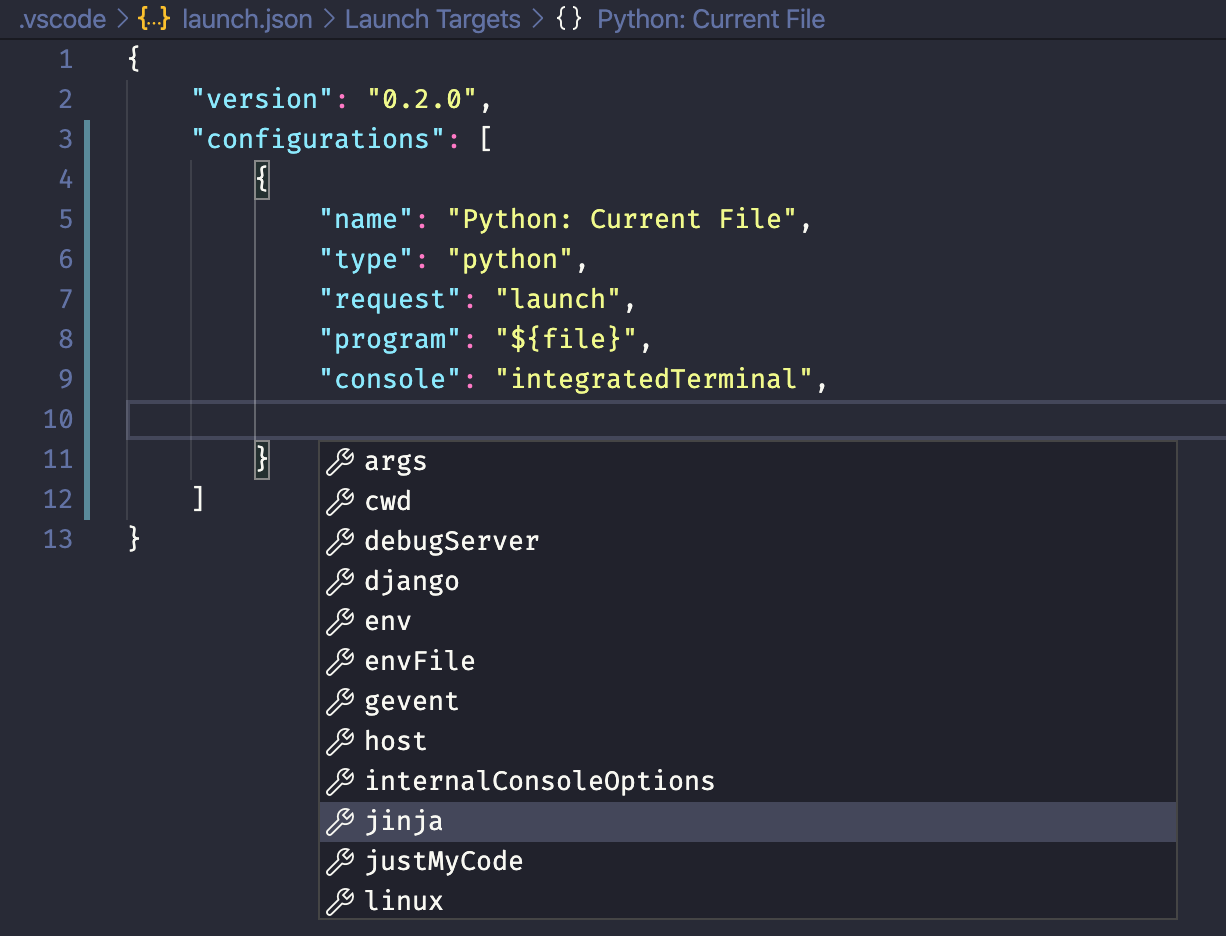
Since we chose the python debugger, there is a collection of attributes we can include and it is possible to discover which one with vscode IntelliSense.
- Click Ctrl + Space or ⌃ + Space to see the list of available attributes (has to specify the
typeattribute beforehand) as shown on the image below.
Conclusion
This tutorial showed what debugging is really about and how to do it with different tools. We’ve seen that debugging is a method of investigating code and can be used to learn what a program does and to remove its problems.
Besides, Python is a programming language that comes with a debugger included. Using breakpoint() we can already deal with most of the debugging scenarios a developer would face. Furthermore, it helps us munch more than just using print() all over our code.
Finally, we saw how to do all of the basic debugging process and much more with the Visual Studio Code IDE. Harnessing the power of your IDE is necessary for any professional developer, because it will lead you to better solutions faster and with less effort.
There is much more to these python debugging tools than I can show here, but I believe that this should be a good introduction to beginners as well to seasoned programmers that use other tools or other languages.